


 New Relic
 Datadog
 Dynatrace
 Elastic APM
 AppDynamics
 Instana
 Jenkins
 GitHub Actions
 GitLab CI
 CircleCI
 Travis CI
 AWS CloudWatch
 Azure Monitor
 Google Cloud
 Prometheus
 PagerDuty
 Opsgenie
 ServiceNow
 Jaeger
 OpenTelemetry
Grafana
OpenTelemetry
Grafana
 Jira
Jira
 Linear
 ClickUp
GitHub
GitLab
ClickUp
GitHub
GitLab
 Bitbucket
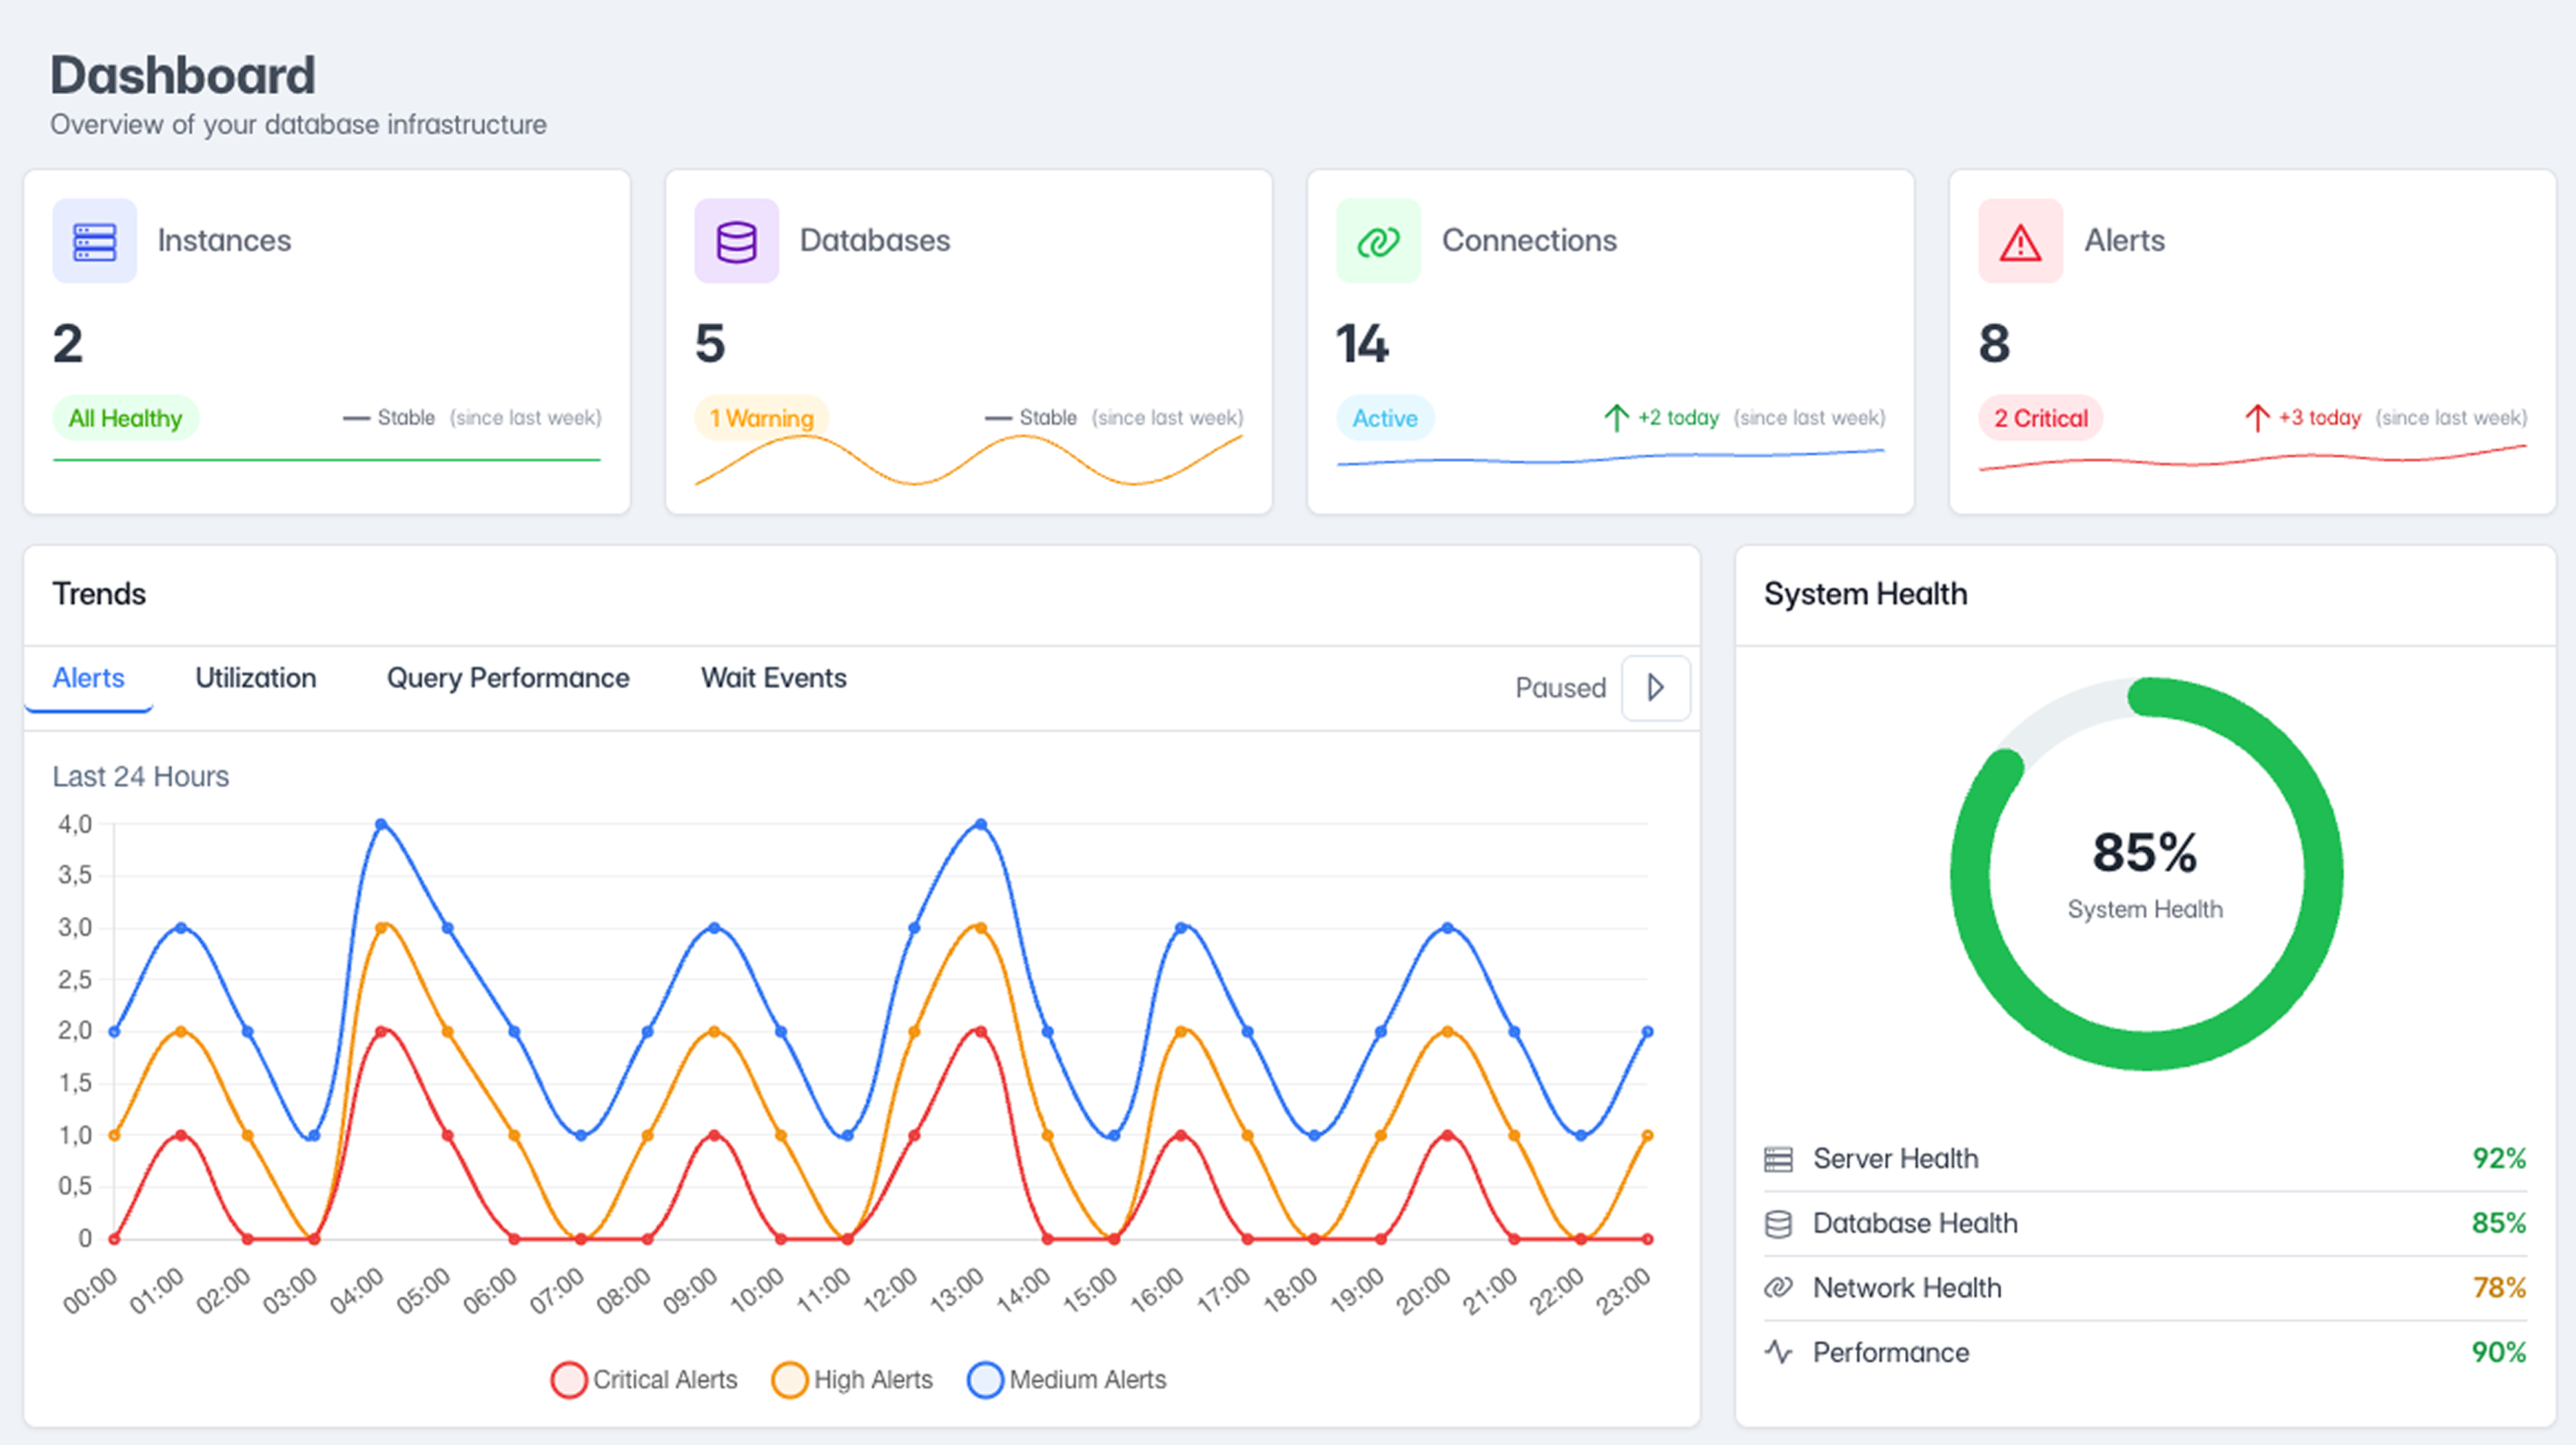
 Always-On Observability
A Live View of Your Database Health.
Stay updated with continuous snapshots of system behavior. See when things begin to drift —
not when they break — and keep performance on track with effortless visibility.
Always-On Observability
A Live View of Your Database Health.
Stay updated with continuous snapshots of system behavior. See when things begin to drift —
not when they break — and keep performance on track with effortless visibility.
 AI-Powered Insights
Understand the Why, Not Just the What.
Go beyond raw metrics. Our platform connects the dots across usage patterns, behaviors, and
misconfigurations to surface meaningful insights and clear recommendations.
AI-Powered Insights
Understand the Why, Not Just the What.
Go beyond raw metrics. Our platform connects the dots across usage patterns, behaviors, and
misconfigurations to surface meaningful insights and clear recommendations.
 Any Database. One Platform.
One Platform, Many Technologies.
Manage all your environments — no matter MS SQL Server, PostgreSQL, MongoDB or Oracle
Database — from a single screen. No context switching, no learning curve, just complete
observability across your systems.
Any Database. One Platform.
One Platform, Many Technologies.
Manage all your environments — no matter MS SQL Server, PostgreSQL, MongoDB or Oracle
Database — from a single screen. No context switching, no learning curve, just complete
observability across your systems.
 Smart Alerts
Know What Matters, Ignore What Doesn't.
We don't just alert on thresholds — we prioritize based on risk and context. You get clear,
relevant alerts that help you act fast without drowning in noise.
Smart Alerts
Know What Matters, Ignore What Doesn't.
We don't just alert on thresholds — we prioritize based on risk and context. You get clear,
relevant alerts that help you act fast without drowning in noise.
 Comprehensive Reporting
Find the Lag Behind the Load.
Quickly spot queries causing drag, delay, or drain on your resources. Understand performance
bottlenecks and get suggestions to fix them — without endless digging.
Comprehensive Reporting
Find the Lag Behind the Load.
Quickly spot queries causing drag, delay, or drain on your resources. Understand performance
bottlenecks and get suggestions to fix them — without endless digging.
 Security & Compliance
Stay Secure. Stay Aligned.
Continuously evaluate your environment's security posture and configuration health. Detect
weak spots, missteps, or drift from best practices — early and clearly.
Security & Compliance
Stay Secure. Stay Aligned.
Continuously evaluate your environment's security posture and configuration health. Detect
weak spots, missteps, or drift from best practices — early and clearly.